

Rating Scales – Risk Appetite

Risk appetite:

In order to assess risks, it is necessary to identify (ideally collectively) the level of risk appetite of the company carrying out the risk mapping. Risk appetite makes it possible to determine the level of risk that a company considers acceptable in order to achieve its objectives, and consequently which risks will be retained, reduced, or avoided. There is no good or bad risk appetite. What matters is agreeing on a common framework within the company.

Risk appetite will naturally not be uniform, for two reasons:

  • Risks that are well known are more readily accepted. They may even be underestimated because they are seen as part of the usual environment in which the company has always operated;
  • Risks that are completely unknown, and whose stakes are not perceived, may be underestimated;

The business leader will need to determine the acceptable appetite for each risk according to the company's structure and values. For example, a company might determine that a product return due to non-conformity is unacceptable because of the financial and image consequences it entails, while another company might consider this risk acceptable.

Risk appetite therefore influences how risks are positioned. Collective reflection within the company, drawing on varied experiences and viewpoints, will help to better identify individual approaches.


Risk rating:

Risk mapping should allow the business leader to visualize, in a concise way, the major risks likely to seriously affect their company's objectives and challenges. It is a snapshot at a given moment that represents, in an overall and hierarchical manner, the company's main risks, whatever their nature.

To create this hierarchical picture, the user will need to assess each of the risks.

For each question, the risk must be rated (assessed) according to two scales. These two scales are rated from 1 to 4.
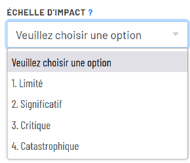
  • The impact scale assesses the consequence should the risk occur.

  1. Limited = Almost no impact.

  2. Significant = Minor impact.

  3. Critical = Significant consequence(s) for the company, negatively affecting its proper functioning.

  4. Catastrophic = Immediate danger to the company's survival.
  • Note that the rating takes into account measures put in place by the company to mitigate the consequence of the hazard. For example, a company with a high fire risk due to the very nature of its activity will have a lower impact assessment if it has implemented measures to limit the impact (sprinklers, fire doors, backup site…)
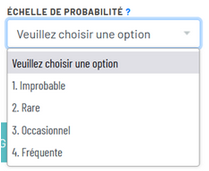
  • The probability scale assesses the frequency of occurrence of a risk.

  1. Improbable = This has never happened and there is no chance of it happening.

  2. Rare = This has never happened and it is unlikely to happen.

  3. Occasional = This has happened a few times and it is likely to happen again.

  4. Frequent = This happens regularly and will continue to happen regularly.

  • Note that the rating takes into account measures put in place to limit the occurrence of a risk. For example, a company with a high fire risk due to the very nature of its activity will have a lower frequency assessment if it has implemented measures to limit its occurrence (fire permits, replacing flammable products with non-combustible ones…)


Graphic Representation:

  • Once you have answered all the questions in the questionnaire, a diagnostic in the form of a summary assessment PDF report on the company's risk management is delivered to you free of charge.
  • The charts summarize all the risks you have rated in two types of diagram.
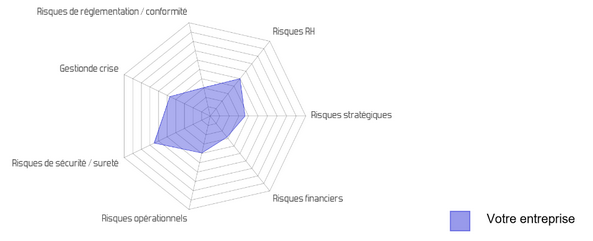
  • The first, "Assessment of risk mastery by major area (base 100)", weights and summarizes the risk ratings by major area. The closer the chart is to 100, the less the area is under control.


Assessment of risk mastery by major area (base 100)

This chart summarizes the risk ratings by area; the closer the chart is to 100, the less the area is under control
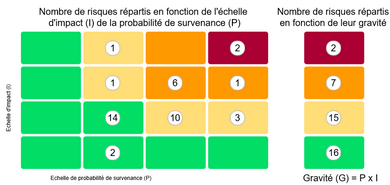
  • The second, "Risk Matrix", provides a visual representation of all risks distributed according to impact and probability assessment. It introduces the severity scale (probability x impact), which divides risks into 4 major categories (red, orange, yellow, green).


Risk Matrix

  • You can then browse, use and share with the people concerned the roughly fifty pages of the report, which faithfully reflect your various answers to the questions.